The Best Metrics to Track Your Website Performance
By
Robert Bond
/ July 19, 2024 July 19, 2024
Analytics Metrics
-
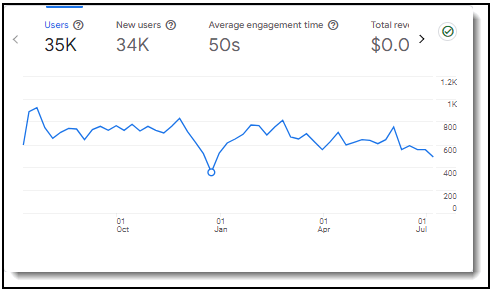
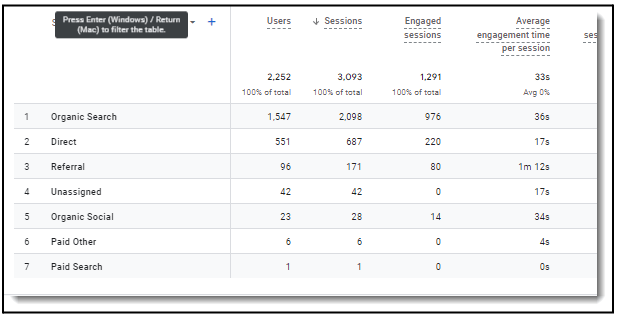
- Sessions or Web Visits: Sessions represent the total number of visits to your website, including repeat visits by the same user. This metric gives you a comprehensive view of your website’s overall traffic and user engagement.
- Session Duration: Session duration measures the total time users spend on your website in a single session. Longer session durations indicate that visitors find your content engaging and valuable. This metric helps you assess the quality of your content and user experience.
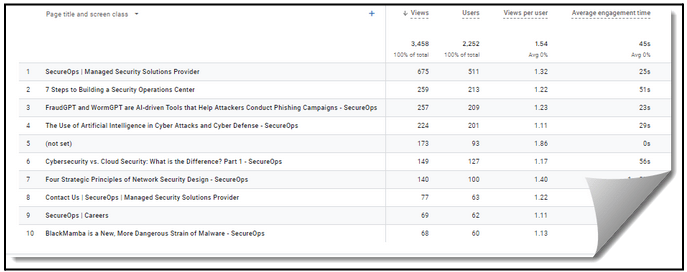
- Unique Visitor Page View Rates: This metric tracks which pages are viewed by unique visitors. You can identify high-performing pages and understand user interests and navigation patterns by analyzing unique visitor page view rates.
- Average Time on Page: Average time on page measures the average duration visitors spend on a specific page. This metric helps you determine which pages hold users’ attention and which may need improvement to increase engagement.
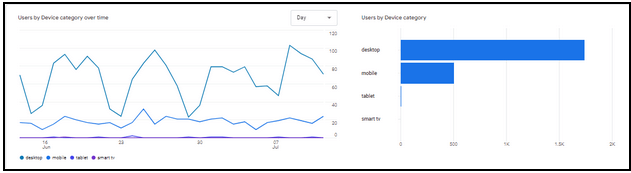
Figure 4 – Mobile Search is Increasing Dramatically, Make Sure Your Site is Responsive
- Bounce Rates: The Bounce rate is the percentage of visitors who leave your website after viewing only one page. A high bounce rate may indicate that your landing pages are not compelling or relevant to users’ needs. Reducing bounce rates can improve user retention and conversions.
- Exit Rates: The rate of users who leave your site after visiting multiple pages. Analyzing exit rates helps you identify pages where users lose interest and abandon your site, allowing you to make necessary adjustments to retain visitors.
- Exit Pages: Exit pages are the specific pages where users leave your website. Understanding which pages common exit points are helps you pinpoint potential issues in your site’s content or navigation and take corrective actions to improve user flow.

Figure 5 – The Above Image Illustrates where Organizations want to be in terms of tracking Marketing Success
Conclusion
Tracking these metrics provides a comprehensive understanding of your website’s performance and user behavior. By leveraging data from incoming traffic sources, broad metrics, and detailed analytics, you can make informed decisions to enhance your online presence, improve user engagement, and drive business growth.
As all marketing folks know, trends won’t emerge immediately, and collecting the raw data and tracking it monthly or weekly is painstaking. However, after several months, you will discover insights such as what is driving users to your website, how many are exiting after they read the blog post, how much of your traffic is organic versus direct, and whether your social media is driving traffic. Regularly monitoring and analyzing these metrics will ensure that your digital marketing strategies remain effective and aligned with your business goals.